

ETFBOOK's Product Revenue module estimates fee revenue for every ETF across Europe and the US, at fund and share class level. It reports two figures: Revenue, meaning what a product earns over a full year at its current size and price, and Net New Revenue, meaning how much incremental revenue the period's net flows produced.
The Product Revenue module for ETF analysis in a nutshell
Our new Product Revenue module estimates annual fee revenue for every ETF in ETFBOOK's European and US coverage, at fund level and at share class level, alongside the revenue attributable to the period's net flows. Four views sit on the same data: a sortable table of every product, revenue plotted against assets, new revenue plotted against flows, as well as both metrics tracked across the period you select, down to daily. The figures in this article use the European universe.
With the launch of the Product Revenue module, that assembly work is no longer manual. Producing this by hand means exporting AuM and net flows, since net flows drive the Net New Revenue figure, joining a fee schedule share class by share class, and rebuilding the dataset every month. With ETFBOOK, it now automatically sits in one view next to flows and assets, on the same T+1 data.
Fund level answers how a product is performing as a market proposition. Share class level is where the same question gets monitored technically, accounting for different currencies and income distribution mechanisms. Both views are available from the same toggle, and both are also available as exports for further analysis.
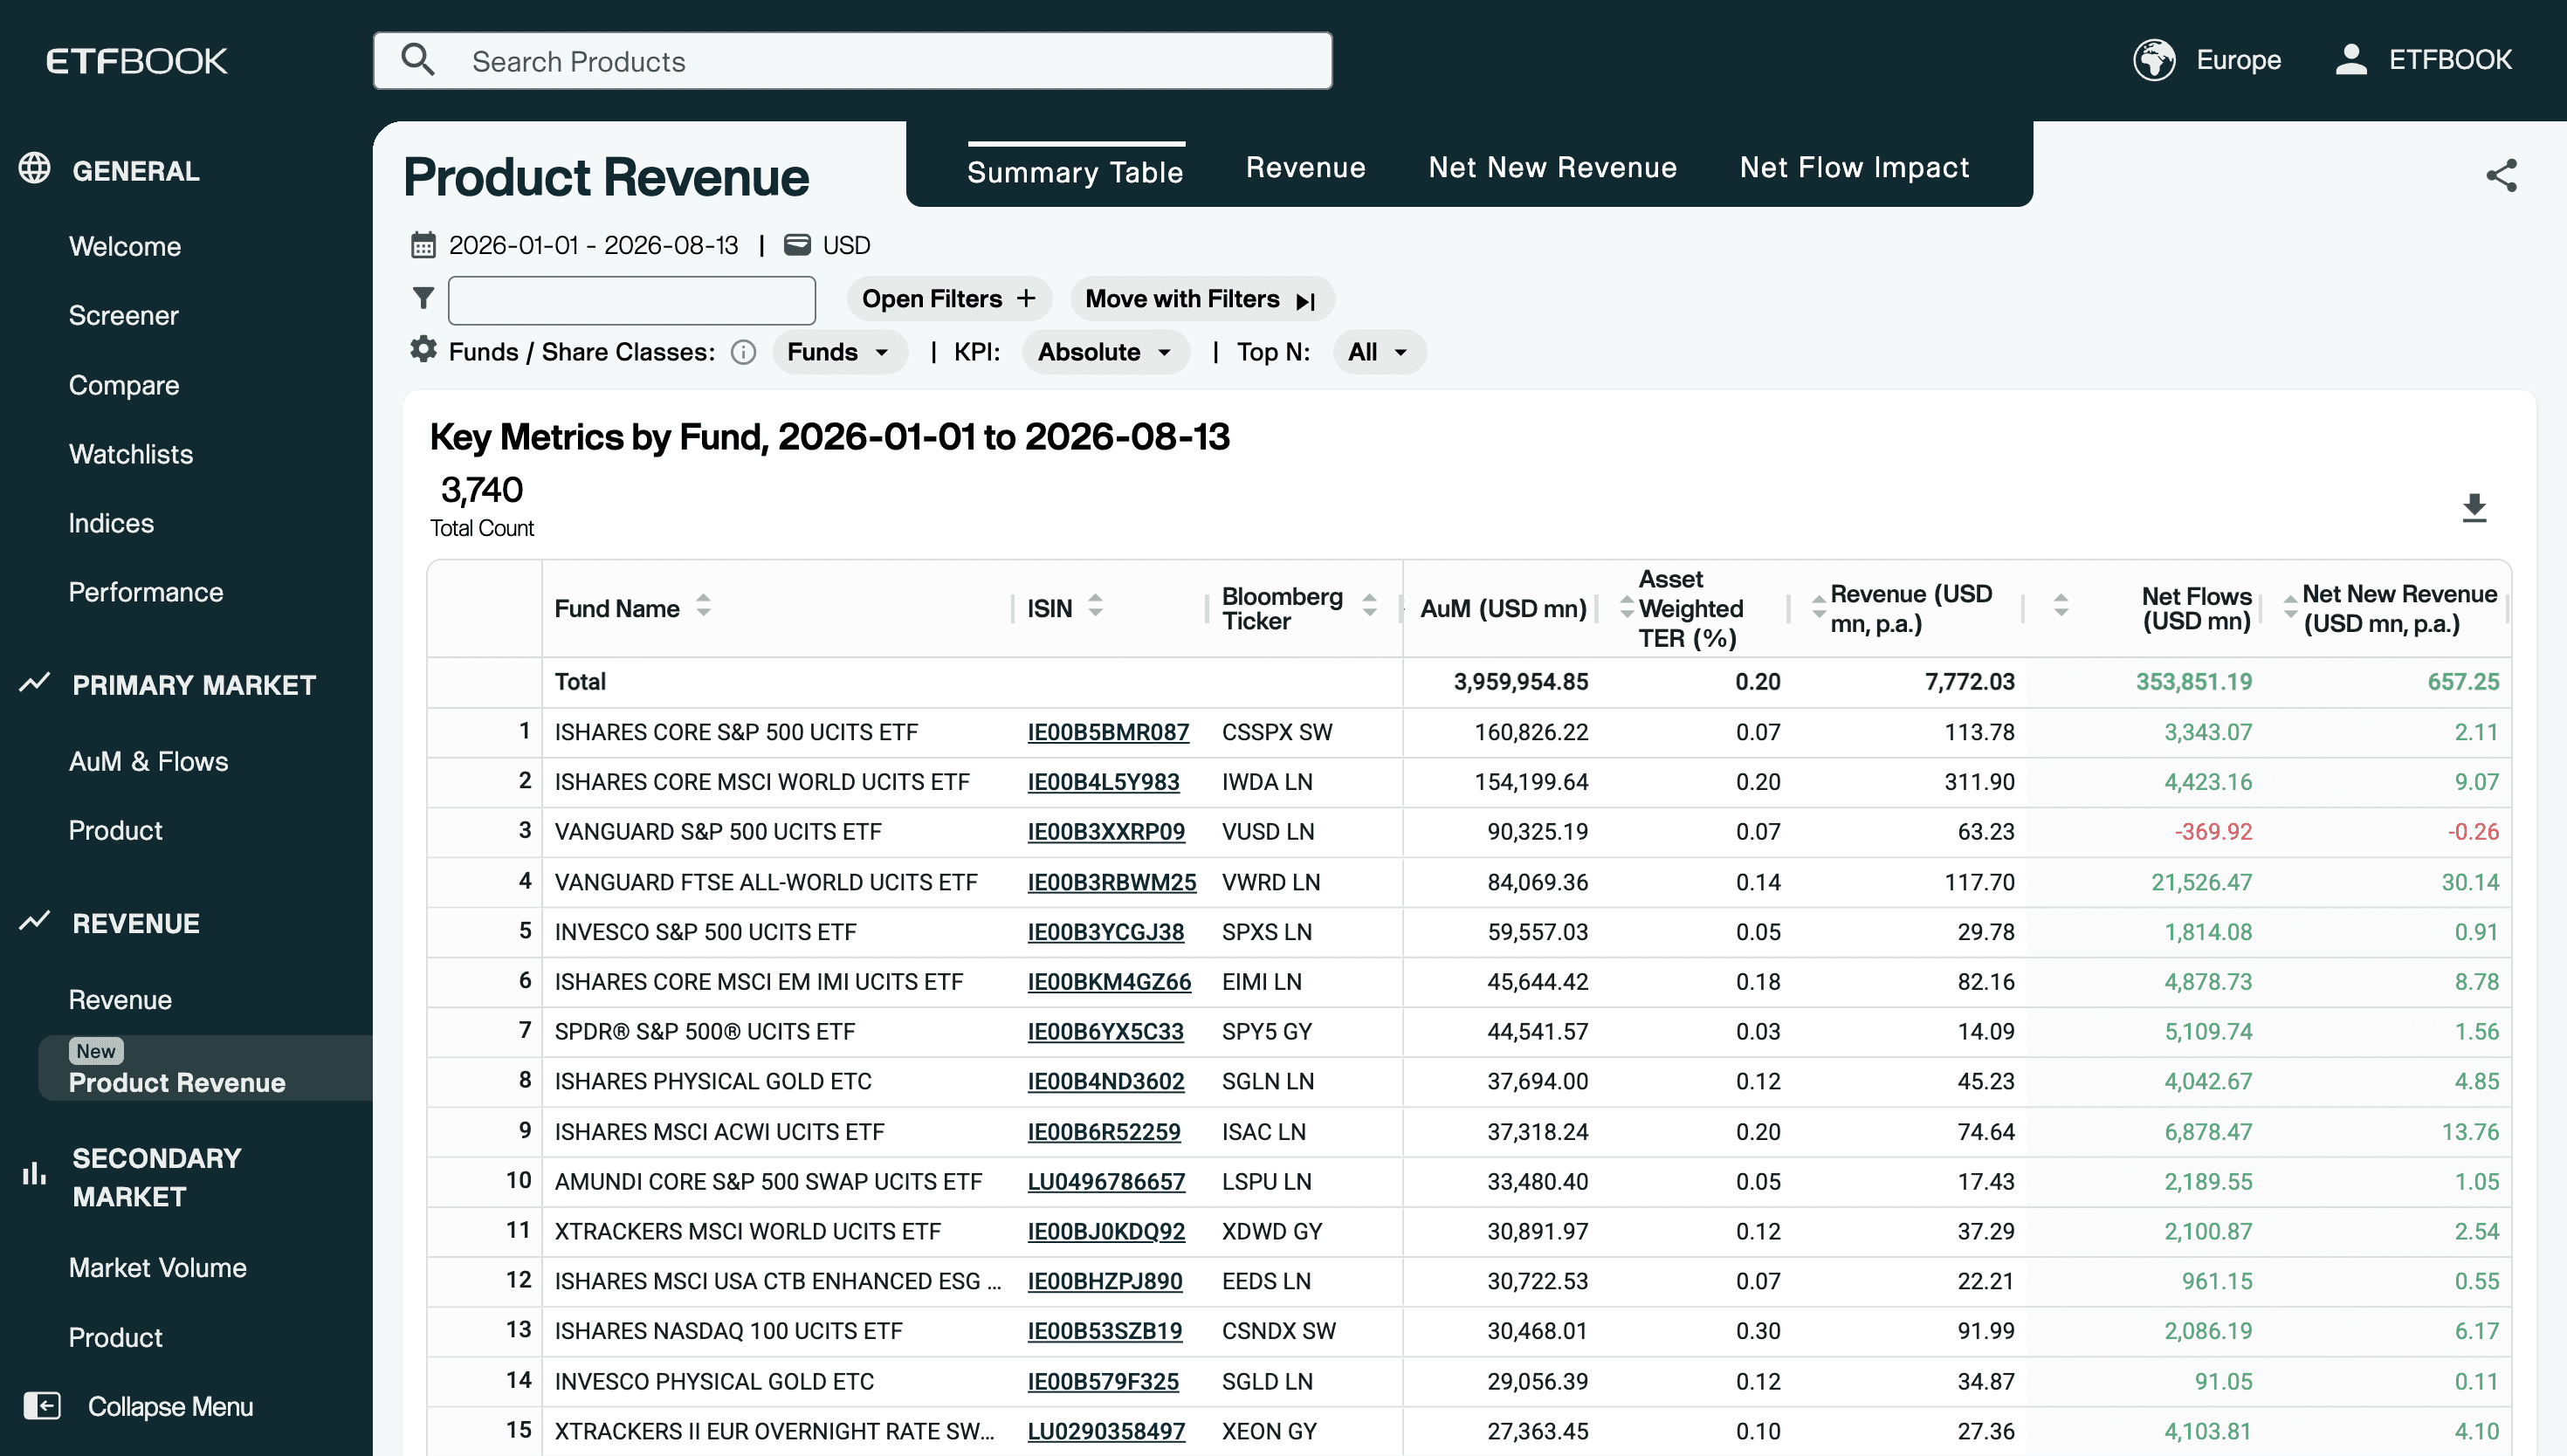
Europe's fifteen largest ETFs by assets, with estimated annual fee revenue alongside. Source: ETFBOOK, data as of August 2026.
How the Product Revenue data presents a birds-eye view in seconds
Read the top two rows of that table. Europe's largest ETF is the iShares Core S&P 500 UCITS ETF, at $160.8bn. The second largest is the iShares Core MSCI World UCITS ETF, at $154.2bn. On the other hand, the MSCI World product is 4% smaller, comes from the same issuer, serves broadly the same buyers, and generates an estimated $311.90m a year in fee revenue against the S&P 500 product's $113.78m. The whole $198m difference is price: 0.20% against 0.07%.
That comparison does not appear in the rankings the industry uses. AuM tables rank accumulated demand. Flow tables rank current demand. Neither is priced, so the products generating the most revenue are assessed on measures that exclude revenue entirely.
Diving deeper into the pool of $7.8bn/year in ETF product revenues
Across the 3,740 European funds ETFBOOK tracks, estimated fee revenue runs at $7,772.03m a year on $3,959,954.85m of assets, on an asset weighted TER of 0.20%, as of August 2026. Net flows of $353,851.19m so far this year added an estimated $657.25m to that annual run-rate, growth of 8.5% from flows alone.
Divide new revenue by new money and this year's flows arrived priced at roughly 18.6bp. Divide revenue by assets and the existing book sits at roughly 19.6bp. Inflows are priced about a basis point below the existing book, which is fee compression showing up as mix rather than as headline price cuts. It is a slow effect and an entirely invisible one if you only count assets.
For context: aggregate fee revenue for the US fund market is published annually by leading providers at manager level. Product-level revenue for the European universe, moving with the same daily flow and asset data, is not available from the standard sources. ETFBOOK's Product Revenue module closes this gap with T+1 updates for both the US and European markets.
Ranking the ETF products by revenue to identify the true winners
Every column in the Summary Table sorts, and every column header carries its formula on hover. At its core, the revenue column answers one question: what does this product earn over a full year, at its current size and current price.
Sort the European universe by revenue instead of assets and the order changes. The iShares Core MSCI World UCITS ETF leads at an estimated $311.90m, and Europe's largest fund by assets comes third. Four of the fifteen highest-earning funds were in net outflow as of August 2026.
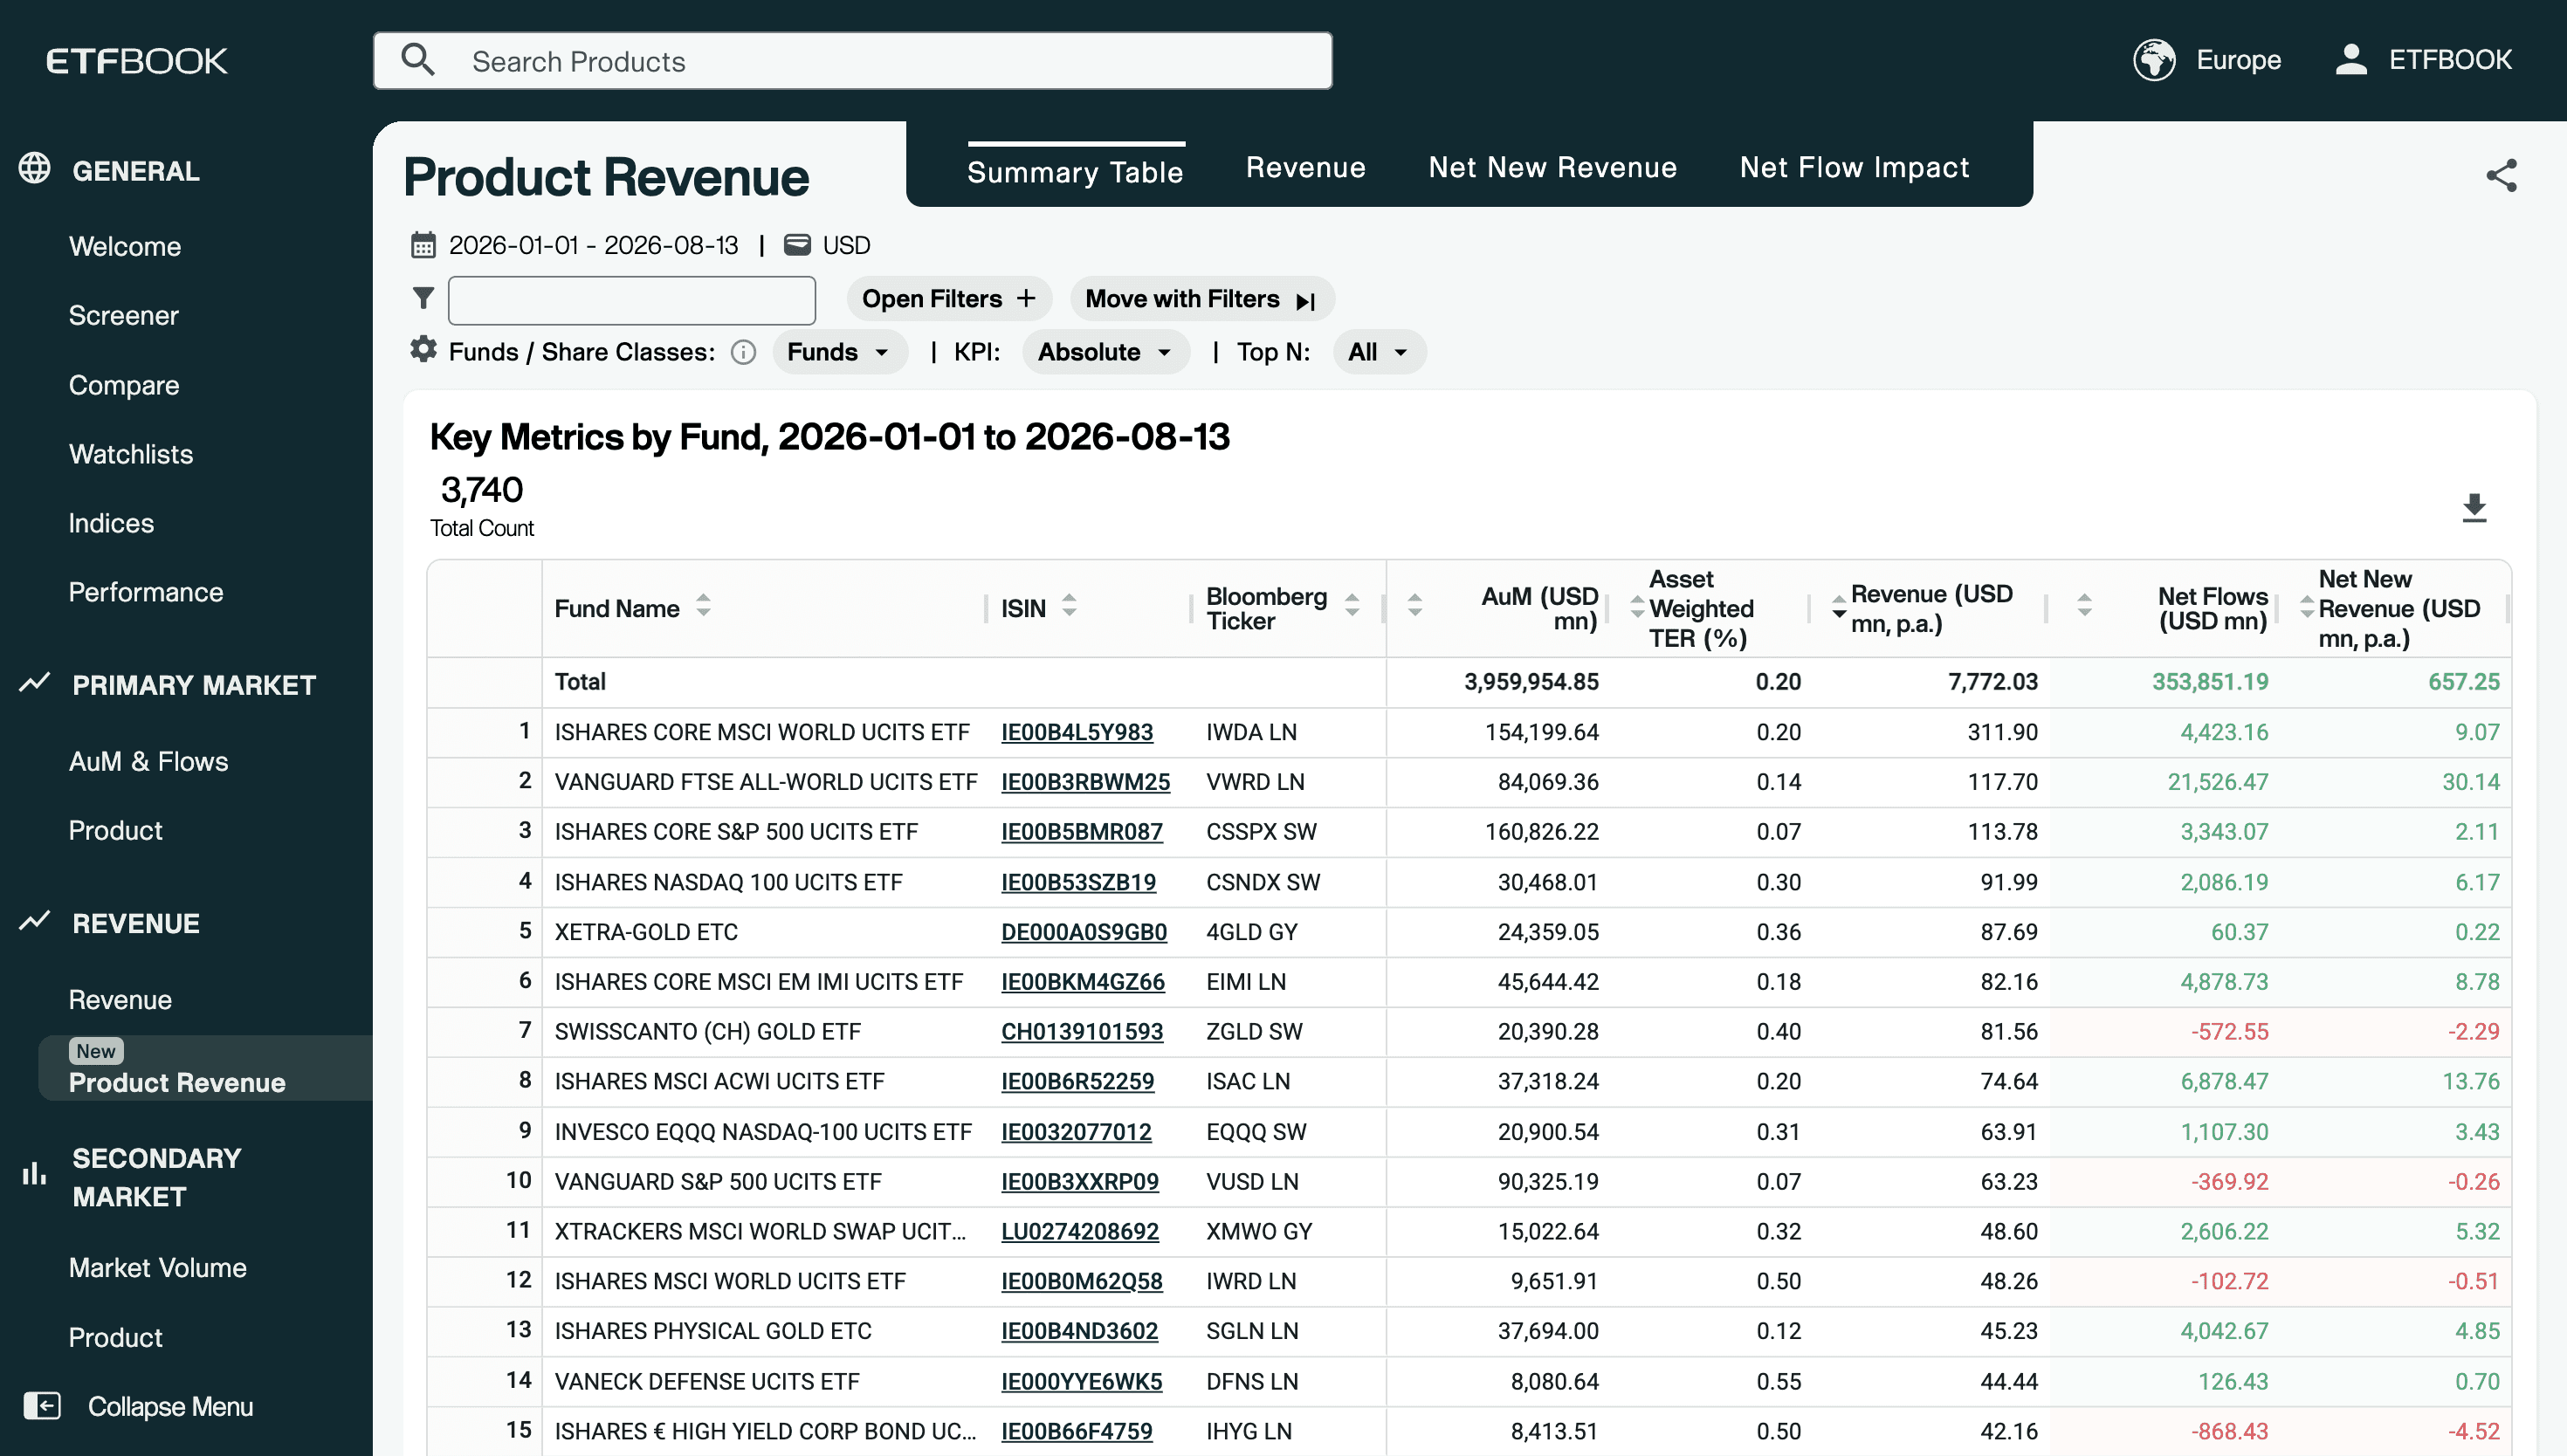
Europe's fifteen highest-earning ETFs and ETCs by estimated annual fee revenue. Source: ETFBOOK, data as of August 2026.
Visual benchmarking of revenue against assets
Plotting revenue against assets across the universe shows the same thing structurally. As visualized on the chart below, the relationship is not a line. At any given asset level the vertical spread is wide, and where a product sits within that spread is a pricing decision, taken years earlier and compounding since.
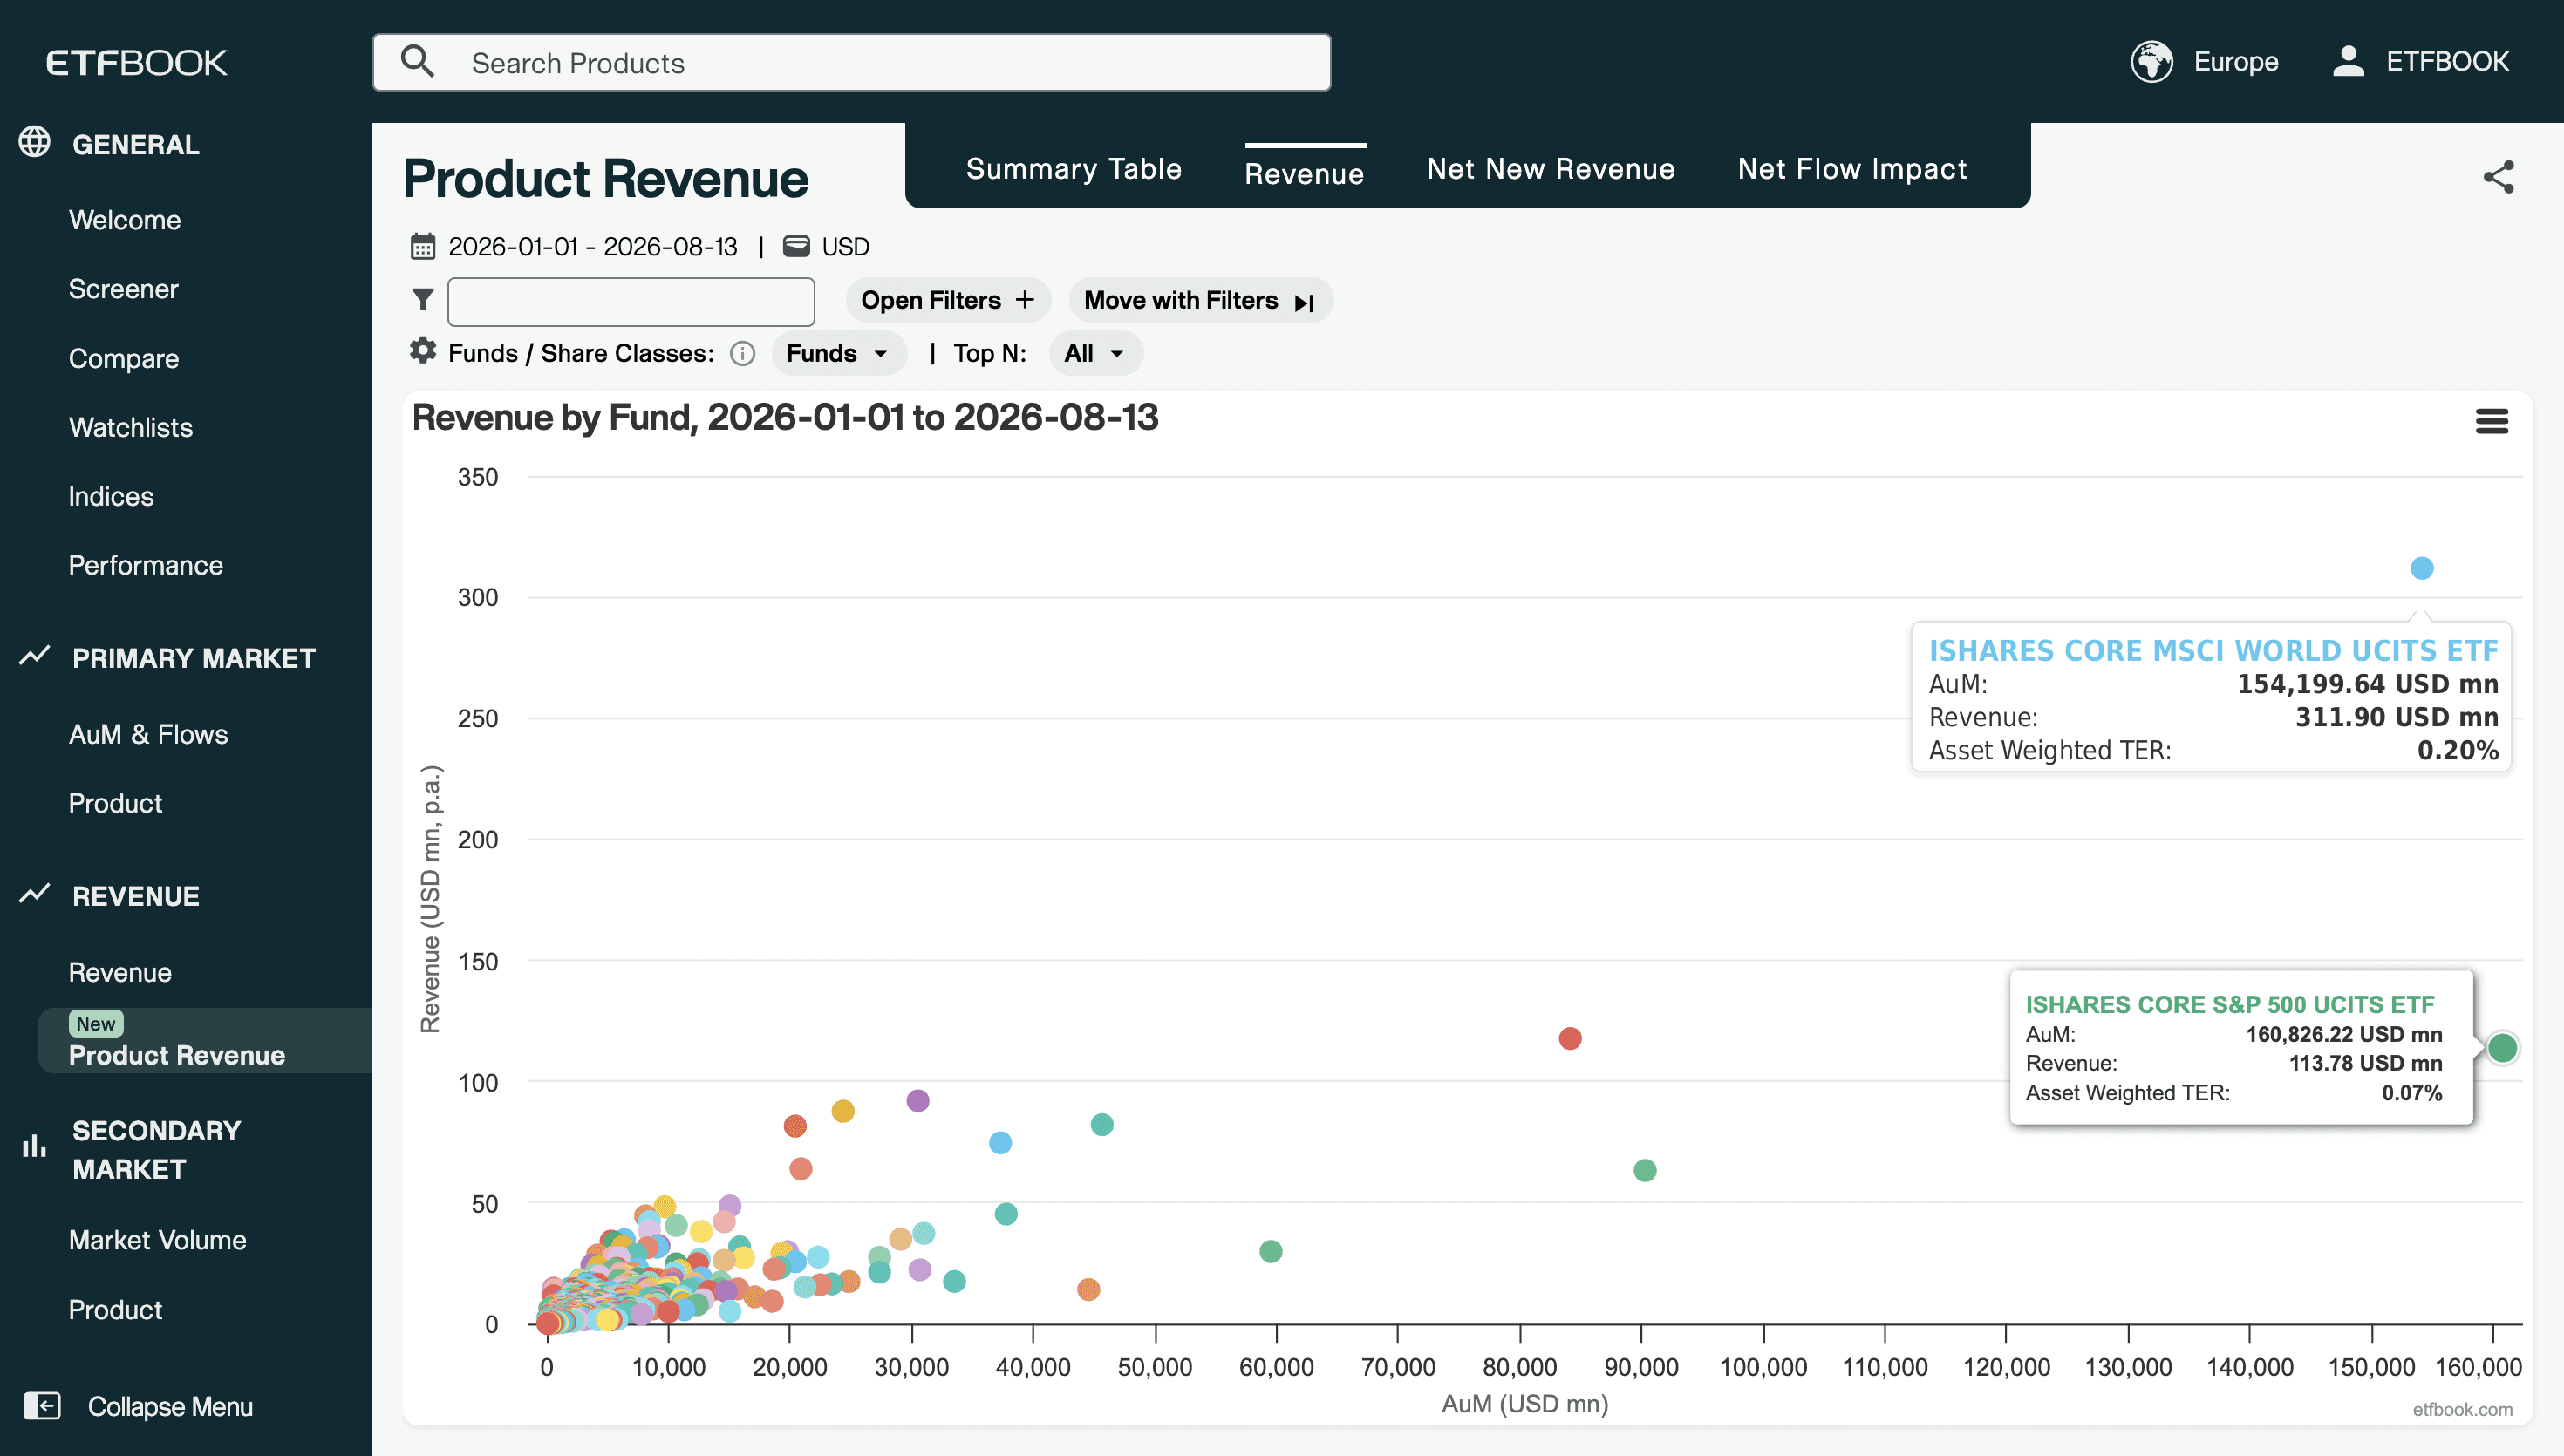
Estimated annual fee revenue against assets on a scatter plot, European ETFs. Source: ETFBOOK, data as of August 2026.
For example, the iShares pair sits in this chart as two points at almost the same place on the horizontal axis (AuM) with a threefold gap on the vertical (Revenue).
Visual benchmarking of net new revenue against flows
The same universe with net flows on the horizontal axis and the revenue those flows generated on the vertical. Two things are readable at a glance.
First, there are two routes to the same result. Vanguard's FTSE All-World UCITS ETF sits far right on volume: $21,526.47m of net flows at 0.14%, an estimated $30.14m of Net New Revenue. VanEck's Morningstar Developed Markets Dividend Leaders UCITS ETF sits high above the cluster on price, with a fifth of that volume: $4,047.52m at 0.38%, an estimated $15.38m.
Second, vertical position at any given flow level is the fee decision. SPDR's MSCI All Country World UCITS ETF gathered $8,774.18m at 0.13% for an estimated $10.87m – more than twice VanEck's flows for about 30% less new revenue. Flow rank and revenue rank are not the same ranking.
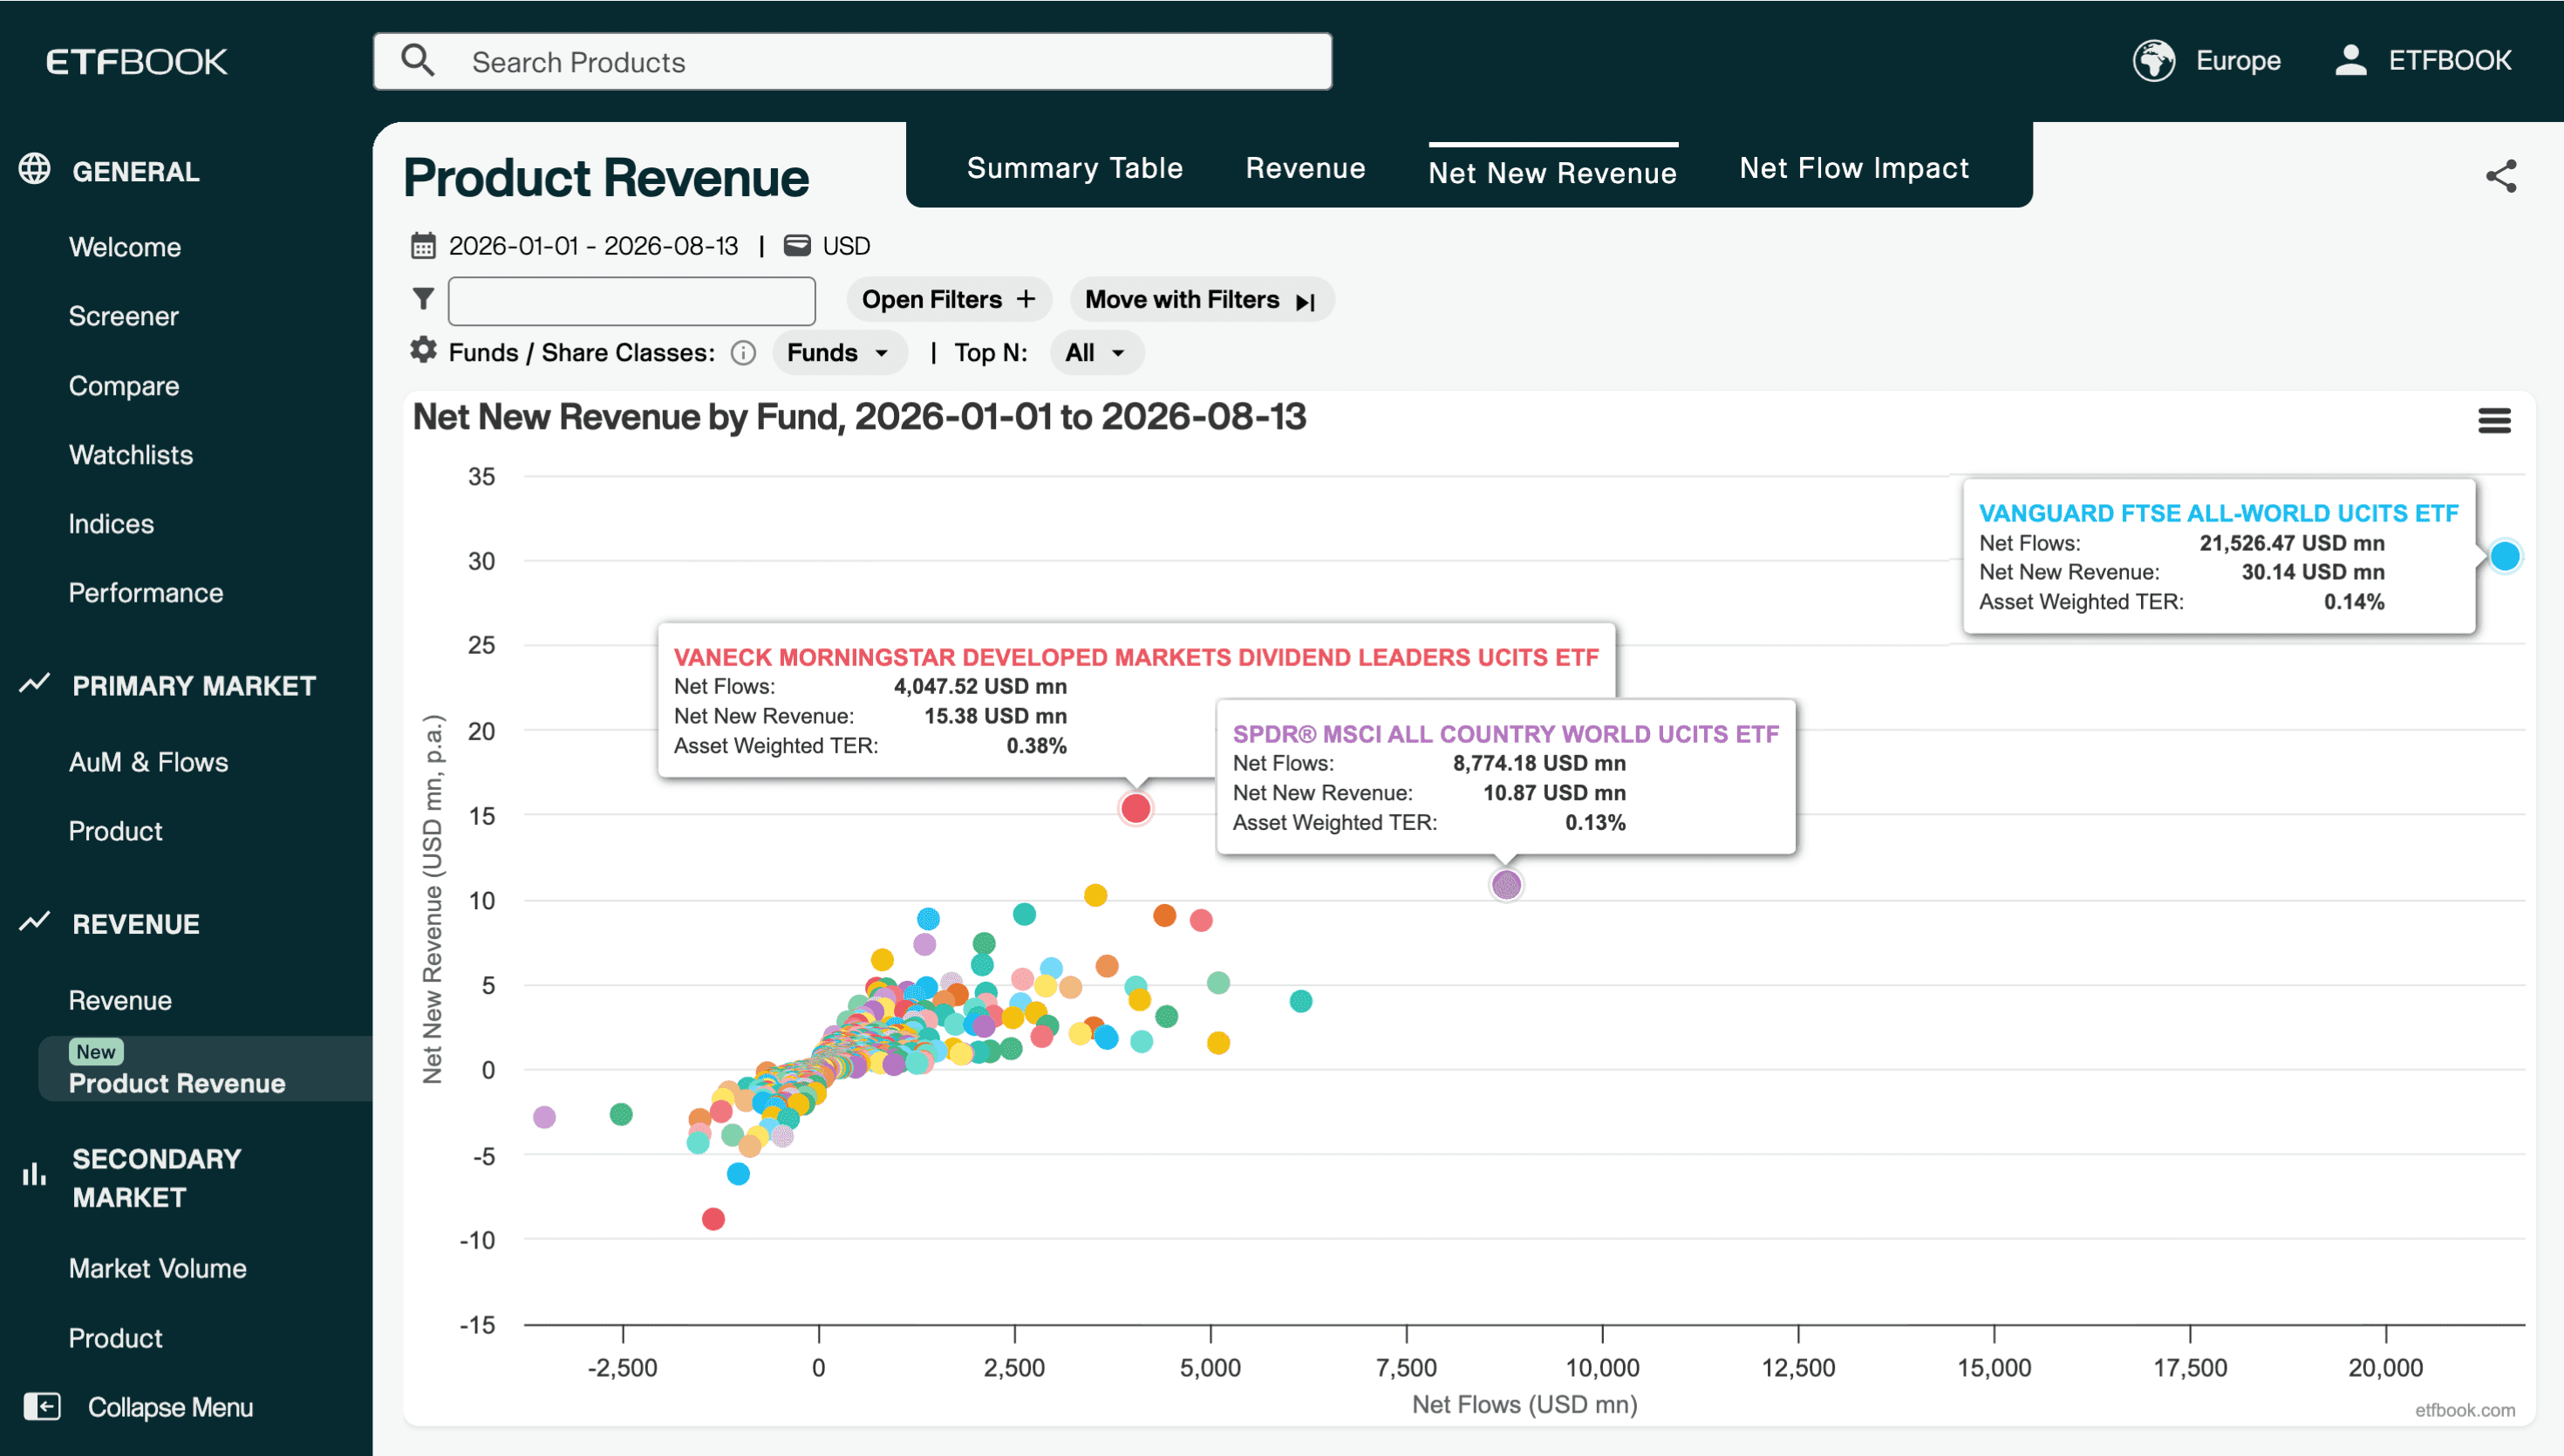
Estimated new annual revenue against net flows. Source: ETFBOOK, data as of August 2026.
Spotting the outliers on the timeline
March 2026 stands out. European ETPs took in $12,164.20m of net new money that month and the estimated revenue impact of those flows was negative $9.92m. Net flows were positive, but those net flows led to lower revenue.
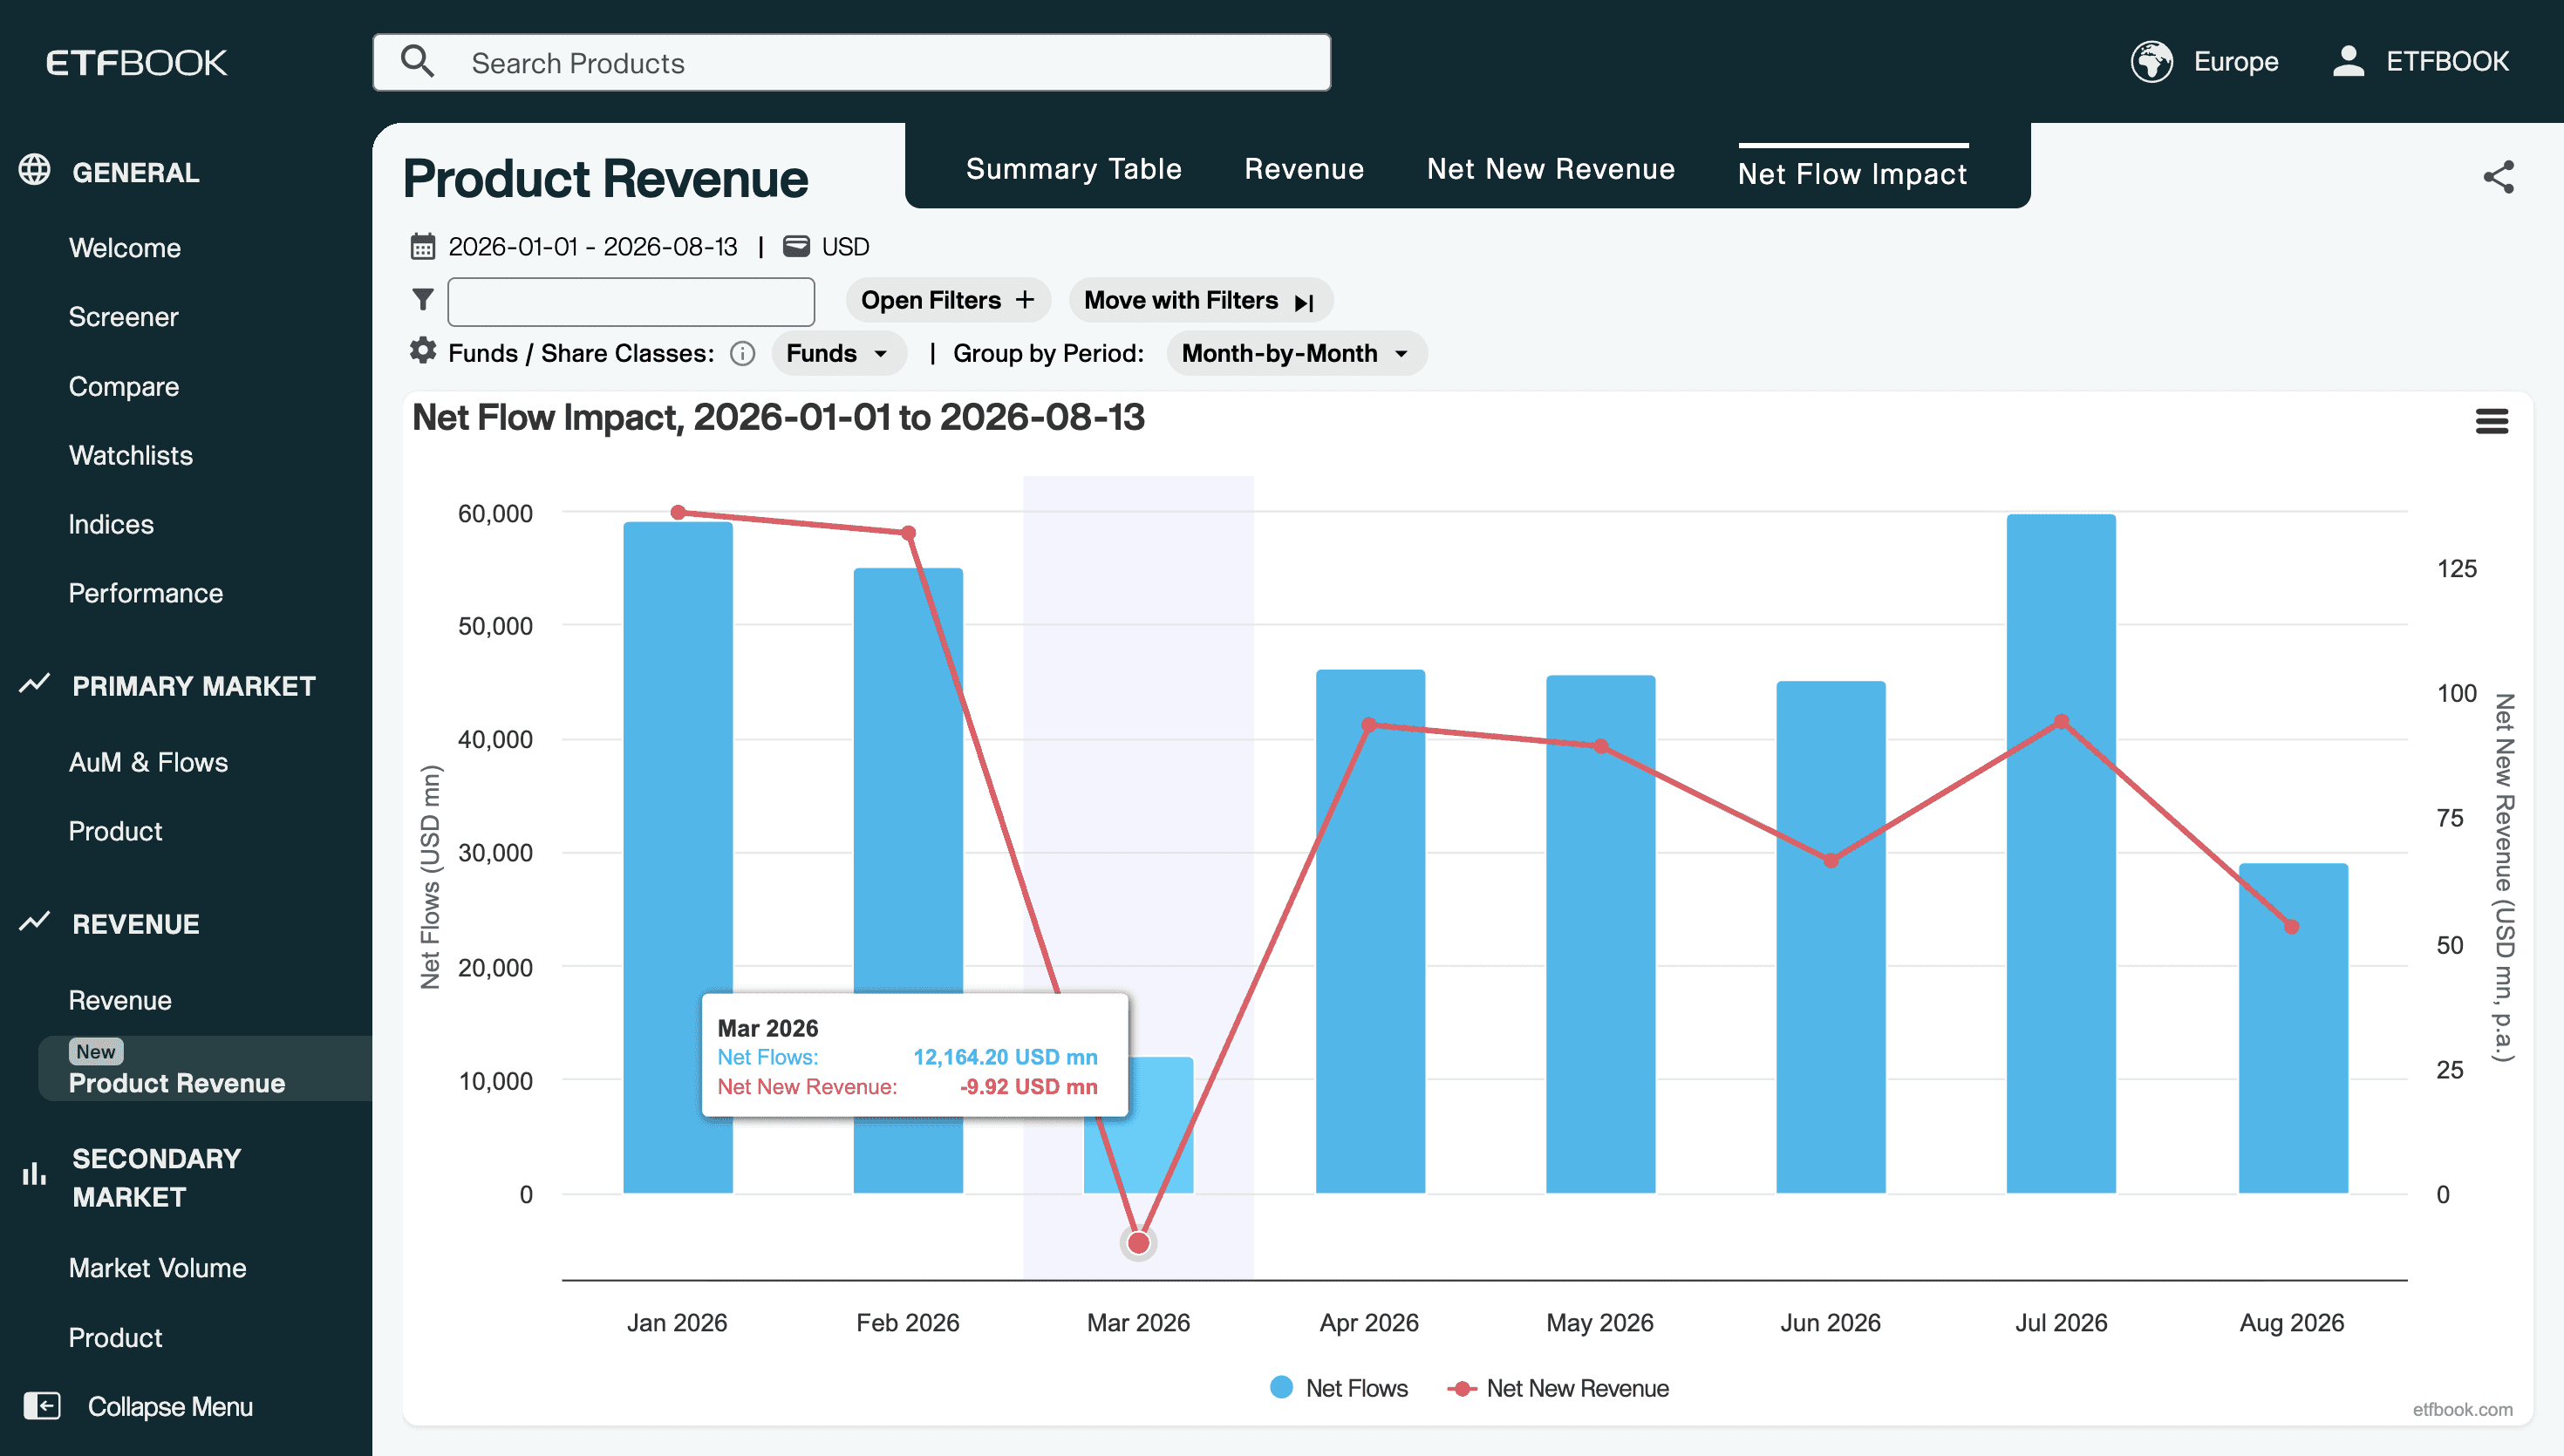
March 2026: $12.2bn of net inflows into European ETPs, and an estimated $9.92mn off the annual fee revenue run-rate. Source: ETFBOOK, data as of August 2026.
The mechanism is in the Net Flow Impact definition: the figure moves against net flows when the money arriving is priced below the money leaving.
Read as a pair, the two series answer a question the flow series cannot. Bars rising with the line rising means the market is growing and getting dearer. Bars rising with the line flat or falling means volume is being won in cheaper products, which is a mix shift rather than a demand story. Grouping the same view by segment, issuer or asset class then shows where the shift came from.
Where the revenue sits inside a fund – revenue data across share classes
According to ETFBOOK's methodology, product revenue is calculated at share class level and rolled up to the selected grouping, so a fund-level figure is a sum of its share classes rather than an approximation of them. Filter to a fund, including all its share classes, then switch the toggle to Share Classes, and the arithmetic is visible.
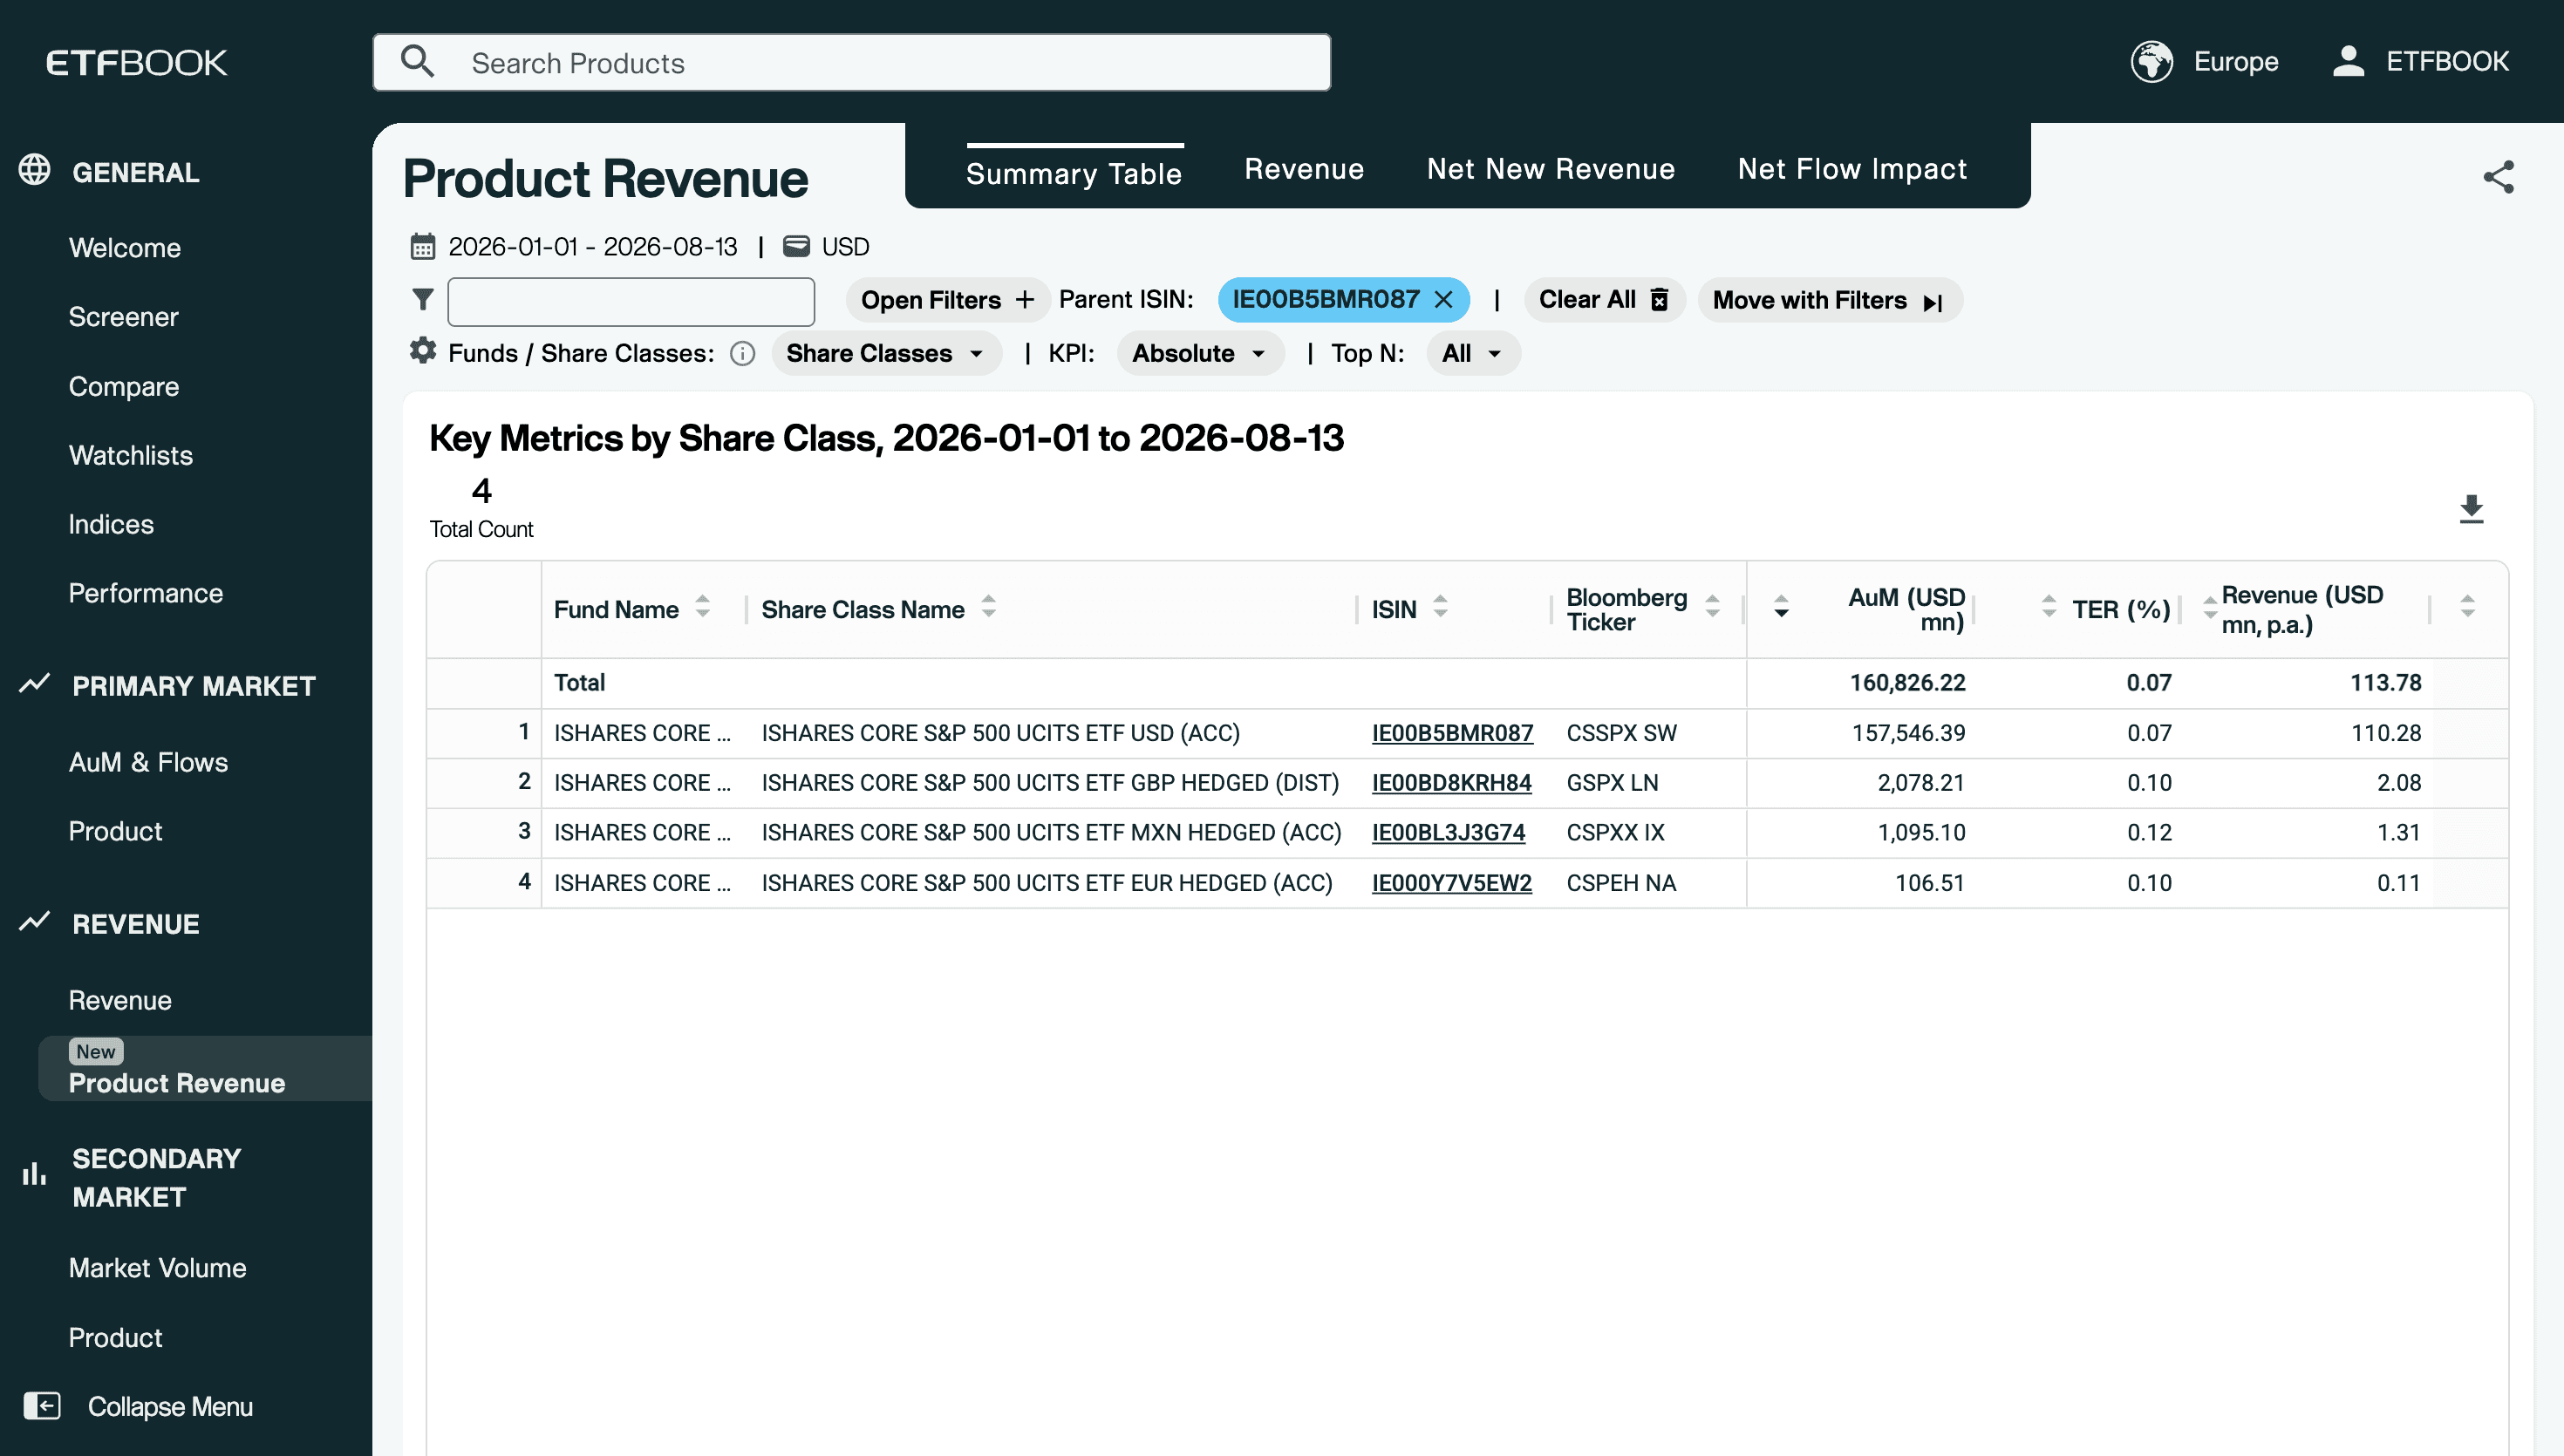
The four share classes of the iShares Core S&P 500 UCITS ETF. Source: ETFBOOK, data as of August 2026.
The iShares fund from the earlier comparison has four classes. The USD accumulating class holds $157.5bn at 0.07% and accounts for an estimated $110.28m. Three hedged classes, at 0.10% to 0.12%, hold $3.3bn between them and account for $3.50m. The four sum to $113.78m, the fund-level figure. So the hedged classes hold 2% of the assets and generate 3% of the revenue, and the only averaged number on a fund row is the asset weighted TER.
The methodology powering ETFBOOK's Product Revenue calculations
The three definitions below carry the methodology behind this module:
Revenue (USD mn, p.a.)
ETF provider revenue p.a. = AuM (as of the End Date) × TER (as of the End Date). Example: 1,000 mn AuM × 0.10% TER = 1 mn p.a. Calculated at share class level and rolled up to the selected grouping level.
Asset Weighted TER (%)
Σ(AuM (as of the End Date) × TER (as of the End Date)) / Σ(AuM (as of the End Date)). Calculated across the fund's share classes using AuM weighting.
Net New Revenue (USD mn, p.a.)
ETF provider revenue impact p.a. from Net Flows = Net Flows (in the selected period) × TER (as of the End Date). Example: 1,000 mn net flows × 0.10% TER = 1 mn p.a. Can be positive even if net flows are negative, if outflows are from lower-TER products and inflows into higher-TER products. Calculated at share class level and rolled up to the selected grouping level.
How to use the Product Revenue data to support strategic decisions
Rank the shelf on revenue as well as assets, and look at the products where the two ranks disagree most, in both directions. A large, cheap flagship generating less than a mid-sized fund is not necessarily a problem. Flagships buy shelf space and distribution relationships, but it should be the data layer underneath guides the decision rather than instincts. The same test applied to competitors shows which of their launches are adding revenue rather than assets.
Then look at the revenue you are earning from products in outflow. Four of Europe's fifteen highest-earning funds were shrinking as of August 2026, and a legacy share class generating tens of millions a year is both an asset and a potential liability: it is funding the business today, but it may be the first thing a competitor undercuts.
At the same time, treat a flow win into a 3bp product as a different result from a flow win into a 38bp one. Both rates appear in the tables above, and the same dollar of net new money is worth nearly thirteen times as much in the second case.
Try the new Product Revenue module
Product Revenue data is available in the ETFBOOK 2.0 web platform and via API. Clicking any cell in the Revenue module opens Product Revenue filtered to the products behind that figure, at fund or share class level.
Explore Product Revenue on the platform or if you do not have platform access yet, request a free trial of ETFBOOK.
